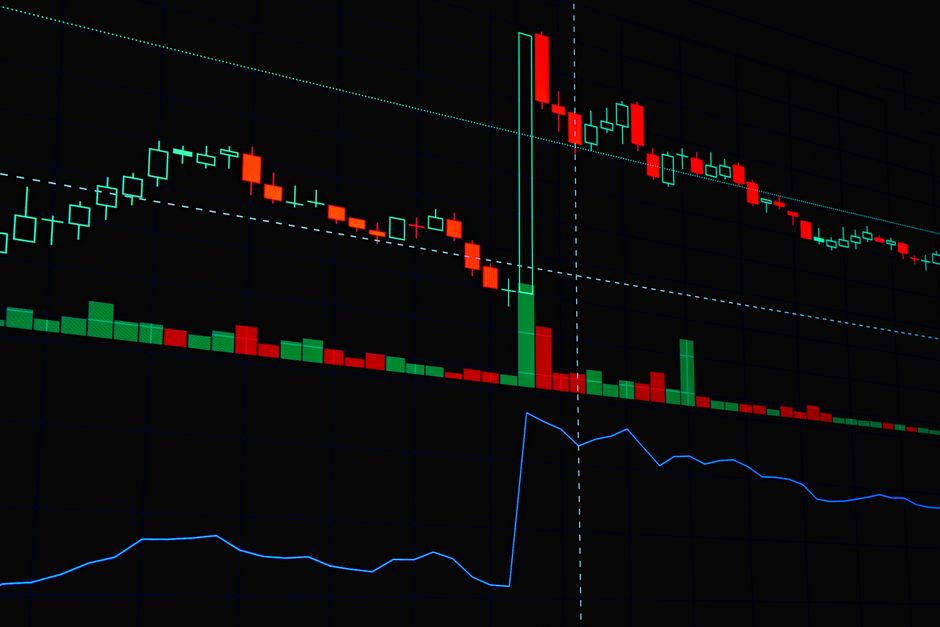
The Nifty 50 Index is currently testing a major structural horizontal support area after a short‑term downtrend marked by lower highs and lower lows. At this critical level, the market has printed a bullish Harami candlestick pattern, indicating that the aggressive downward momentum is pausing. Declining volume and a bullish RSI divergence—price making a lower low while the RSI forms a higher low—confirm that sellers are losing strength.
Technical analysts view the Harami as a pause rather than an immediate reversal signal. Validation of a potential bullish shift will require the next daily candle to close decisively above the pattern’s high, showing buyers re‑entering the market. Traders will watch for a daily close above the Harami’s high to confirm a bullish reversal.